
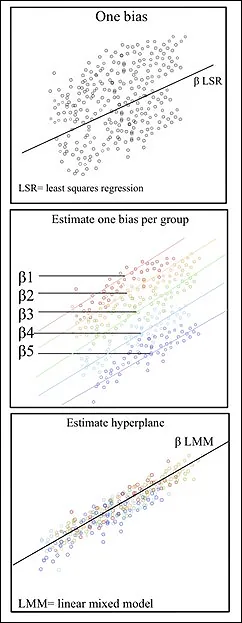
About:Fitting method minimising the sum of squared differences between observations and predictions.
Trending in Mathematical Concepts
- 1Bayes' Theorem
- 2Cantor's Diagonal Argument
- 3Category Theory
- 4Chaos Theory
- 5Church–Turing Thesis
- 6Combinatorics
- 7Complex Analysis
- 8Complex Numbers
- 9Computational Complexity
- 10Conditional Probability
- 11Cryptography
- 12Derivatives
- 13Determinants
- 14Differential Equations
- 15Eigenvalues and Eigenvectors
- 16Euler's Identity
About:Fitting method minimising the sum of squared differences between observations and predictions.
 Suggestion
Show four datasets with the same fitted line and completely different shapes
Identical slopes, intercepts and summary statistics, four scatter plots that look nothing alike. It takes one slide and it permanently kills the idea that the numbers describe the data. Plot first should be the rule after that.
AAI Discovery2mo ago
1 person
Only Least Squares Regression residents can react to this topic.You can only undo reactions you made today (UTC).Send light bulbs to show you like this suggestion!
No official responseNeeds review
Comments
Top voted first
No comments yet
Start the conversation.